top of page
explore a gallery of beautiful plots
Some kendrick and 2D LC/GC-MS plots have intrinsic beauty with surprising alignments and shapes. Here are a few examples. Contact me to submit your best plots !
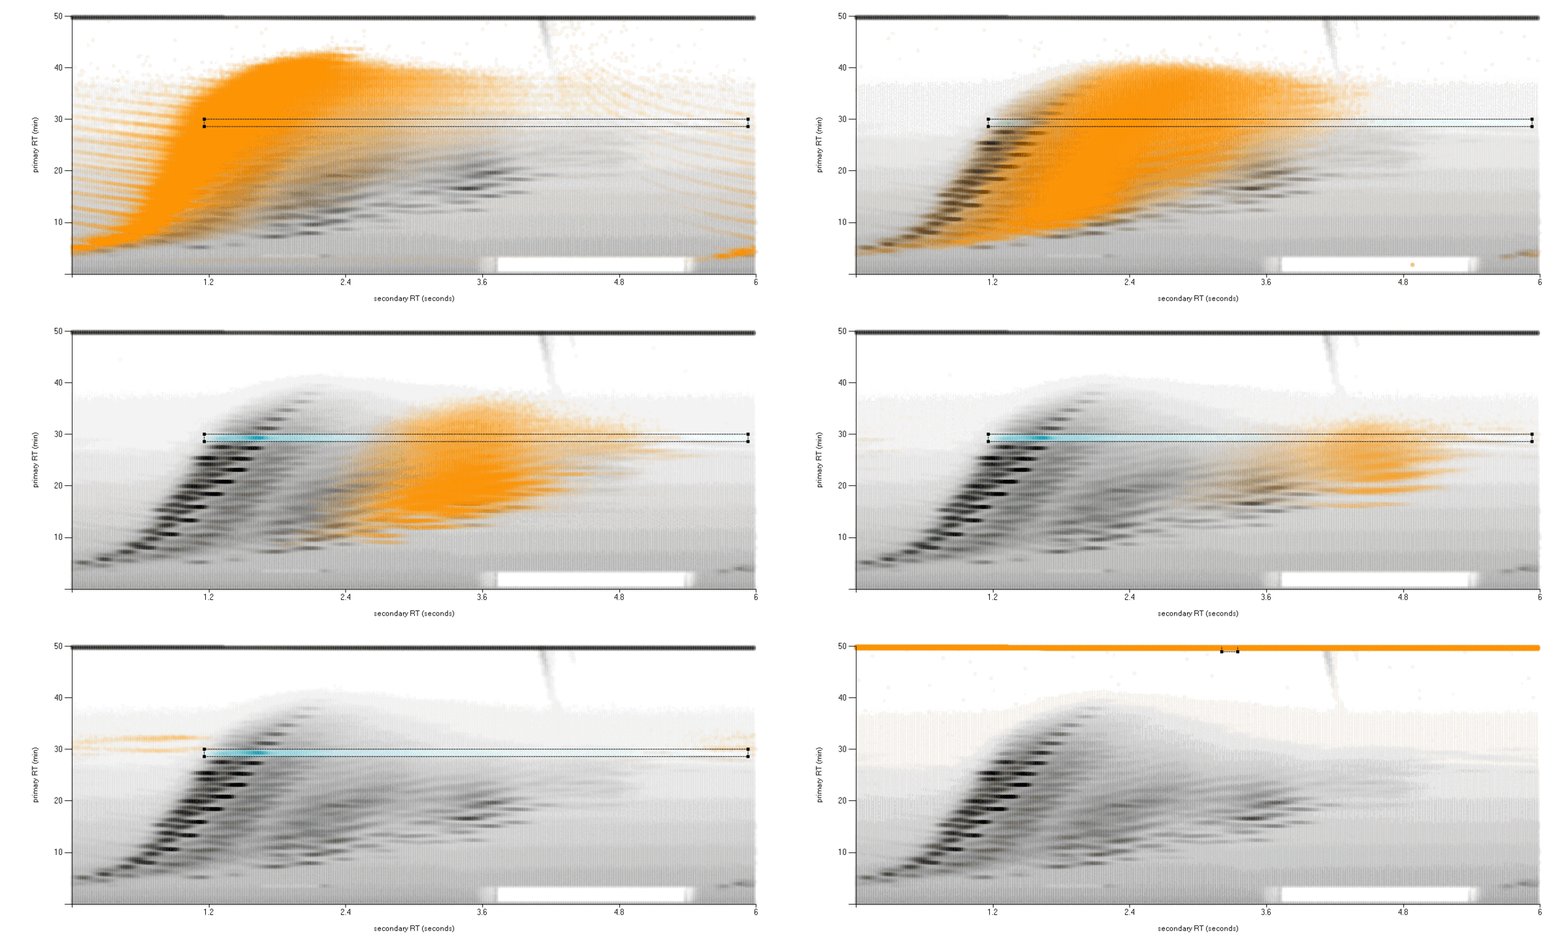
 the arrow shape comes from an artifact (ringing) of the FFT used to generate a mass spectrum from an orbitrap analyzer |  A gif animation showing different ion series extracted from a 2D GCxGC map using Kendrick plots |  A lot of charge states overlapping in the mass spectrum but being resolved in the Kendrick plot, as many lines as the charge state z. |  A kiwi-shaped plot showing the mass defects in the IUPAC scale of all the nuclides of all elements. |
|---|---|---|---|
 A 2D LC-MS map from the LC-MS analysis of a copolymer, reminding tessellations of Escher. |  A mesmerizing Kendrick plot from a cyclic polymer with multiple degree of polymerization and charge states. |
bottom of page